Page 190 - Low Carbon Development in China and India
P. 190
Pollutant Emission from Motor Vehicles in Different 2.3
Scenarios
After setting the scenarios for emission reduction, the CO2 emission
volumes were calculated for the four scenarios by adopting the
establishment method for the emissions inventory of motor vehicles
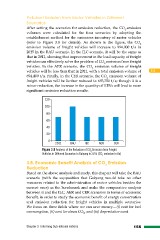
(refer to Figure 3.8 for details). As shown in the figure, the CO2
emission volume of freight vehicles will increase to 994,000 t/a in
2015 in the BAU scenario. In the ILC scenario, it will be the same as
that in 2011, showing that improvement in the load capacity of freight
vehicles can effectively solve the problem of CO2 emission from freight
vehicles. In the AER scenario, the CO2 emission volume of freight
vehicles will be less than that in 2011, with a total emission volume of
694,400 t/a. Finally, in the CER scenario, the CO2 emission volume of
freight vehicles will be further reduced to 693,700 t/a; though it is a
minor reduction, the increase in the quantity of HEVs will lead to more
significant emission reduction results.
Figure 3.8 Analysis of the Reduction of CO2 Emission from Freight
Vehicles in Different Scenarios in Guiyang in 2015 (CO2 emission in t/a)
3.8. Economic Benefit Analysis of CO2 Emission
Reduction
Based on the above analysis and study, this chapter will take the BAU
scenario (with the supposition that Guiyang would take no other
measures related to the administration of motor vehicles besides the
current ones) as the benchmark and make the comparative analysis
between it and the ILC, AER and CER scenarios in terms of economic
benefit, in order to study the economic benefit of energy conservation
and emission reduction for freight vehicles in multiple scenarios.
We focus on three fields where we can save money—(i) cost for fuel
consumption, (ii) cost for clean CO2, and (iii) depreciation cost.
Chapter 3 Informing Sub-national Actions 155
Scenarios
After setting the scenarios for emission reduction, the CO2 emission
volumes were calculated for the four scenarios by adopting the
establishment method for the emissions inventory of motor vehicles
(refer to Figure 3.8 for details). As shown in the figure, the CO2
emission volume of freight vehicles will increase to 994,000 t/a in
2015 in the BAU scenario. In the ILC scenario, it will be the same as
that in 2011, showing that improvement in the load capacity of freight
vehicles can effectively solve the problem of CO2 emission from freight
vehicles. In the AER scenario, the CO2 emission volume of freight
vehicles will be less than that in 2011, with a total emission volume of
694,400 t/a. Finally, in the CER scenario, the CO2 emission volume of
freight vehicles will be further reduced to 693,700 t/a; though it is a
minor reduction, the increase in the quantity of HEVs will lead to more
significant emission reduction results.
Figure 3.8 Analysis of the Reduction of CO2 Emission from Freight
Vehicles in Different Scenarios in Guiyang in 2015 (CO2 emission in t/a)
3.8. Economic Benefit Analysis of CO2 Emission
Reduction
Based on the above analysis and study, this chapter will take the BAU
scenario (with the supposition that Guiyang would take no other
measures related to the administration of motor vehicles besides the
current ones) as the benchmark and make the comparative analysis
between it and the ILC, AER and CER scenarios in terms of economic
benefit, in order to study the economic benefit of energy conservation
and emission reduction for freight vehicles in multiple scenarios.
We focus on three fields where we can save money—(i) cost for fuel
consumption, (ii) cost for clean CO2, and (iii) depreciation cost.
Chapter 3 Informing Sub-national Actions 155