Page 361 - Low Carbon Development in China and India
P. 361
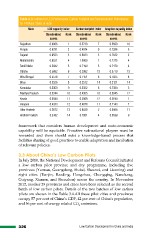
Table 3.3: Indices for LCD Performance, Carbon Footprint and Socioeconomic Performance
for 14 Major States in India
State LCD capacity index Carbon footprint index Adaptive capacity index
Standardized Rank Standardized Rank Standardized Rank
scores scores scores
Rajasthan 0.8086 1 0.5730 7 0.5690 10
Punjab 0.6791 2 0.4974 9 0.7286 6
Gujarat 0.6523 3 0.8033 3 0.7632 2
Maharashtra 0.6521 4 1.0000 1 0.7375 4
Tamil Nadu 0.5832 5 0.7199 5 0.7470 3
Odisha 0.5682 6 0.2962 13 0.3770 13
West Bengal 0.5578 7 0.7151 6 0.7025 8
Bihar 0.5526 8 0.2512 14 0.2121 14
Karnataka 0.5360 9 0.5322 8 0.7334 5
Madhya Pradesh 0.5344 10 0.4365 10 0.5045 12
Kerala 0.5044 11 0.3009 12 0.9244 1
Haryana 0.4333 12 0.4078 11 0.7143 7
Uttar Pradesh 0.3672 13 0.8039 2 0.5068 11
Andhra Pradesh 0.2382 14 0.7951 4 0.6538 9
framework that considers human development and socio-economic
capability will be equitable. Proactive sub-national players must be
rewarded and there should exist a knowledge-based process that
facilities sharing of good practices to enable adaptation and incubation
of relevant policies.
3.3 About China’s Low Carbon Pilots
In July 2010, the National Development and Reforms Council initiated
a low carbon pilot province and city programme, including five
provinces (Yunnan, Guangdong, Hubei, Shaanxi, and Liaoning) and
eight cities (Tianjin, Baoding, Hangzhou, Chongqing, Nanchang,
Guiyang, Xiamen, and Shenzhen) across the country. In November
2012, another 29 provinces and cities have been selected as the second
batch of low carbon pilots. Details of the two batches of low carbon
pilots are shown in the Table 3.4.All these pilot cities and provinces
occupy 57 per cent of China’s GDP, 42 per cent of China’s population,
and 56 per cent of energy related CO2 emissions.
326 Low Carbon Development in China and India