Page 358 - Low Carbon Development in China and India
P. 358
at socio-economic performance, low carbon development performance,
and carbon footprint indices for the 27 states in India. Socio-economic
performance index is based on poverty, literacy, public infrastructure
(electrification and health), and capacity of local institutions to
implement social programmes. For low carbon development (LCD)
performance index, we take performance in interventions related to
grid and off-grid clean energy and also the change in forest cover at
the state level. For carbon footprint index at the sub-national level, per
capita emissions is not used as states with lower population may also be
the states that are not faring well in terms of socioeconomic indicators.
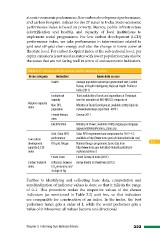
Table 3.2: Indicators and data sources used for developing indices
Index category Indicators Basic data source
Health Average population served per government bed; Central
Bureau of Health Intelligence; National Health Profile of
India (2011)
Adaptive capacity Institutional Total availability of funds and expenditure at Panchayat
index capacity level for execution of MG-NREGS; nrega.nic.in
Non-BPL Ministry of Rural Development; available at http://pib.nic.
population in/newsite/erelease.aspx?relid=49731
Female literacy Census 2011
rates
Electrification Ministry of Power; available at http://rggvy.gov.in/rggvy/
rggvyportal/electrification_status.jsp
Low carbon Grid: Solar RPO Solar RPO requirement and compliance for 2012–13; 3.3
development performance available at http://www.mnre.gov.in/information/solar-rpo/
capacity (LCD)
index Off-grid: Biogas National biogas programme; basic data from
http://www.mnre.gov.in/related-links/decentralized-
systems/schems-2
Forest cover Forest Survey of India (2011)
Carbon footprint Difference between Ramachandra & Shwetmala (2012)
index CO2 emissions and
storage in Gg
Further to identifying and collecting basic data, computation and
standardization of indicator values is done so that it falls in the range
of 0–1. This procedure makes the respective values of the chosen
indicators (as mentioned in Table 3.2) unit less, so that indicators
are comparable for construction of an index. In the index, the best
performer hence gets a value of 1, while the worst performer gets a
value of 0. Moreover, all values become uni-directional.
Chapter 3 Informing Sub-National Actions 323
and carbon footprint indices for the 27 states in India. Socio-economic
performance index is based on poverty, literacy, public infrastructure
(electrification and health), and capacity of local institutions to
implement social programmes. For low carbon development (LCD)
performance index, we take performance in interventions related to
grid and off-grid clean energy and also the change in forest cover at
the state level. For carbon footprint index at the sub-national level, per
capita emissions is not used as states with lower population may also be
the states that are not faring well in terms of socioeconomic indicators.
Table 3.2: Indicators and data sources used for developing indices
Index category Indicators Basic data source
Health Average population served per government bed; Central
Bureau of Health Intelligence; National Health Profile of
India (2011)
Adaptive capacity Institutional Total availability of funds and expenditure at Panchayat
index capacity level for execution of MG-NREGS; nrega.nic.in
Non-BPL Ministry of Rural Development; available at http://pib.nic.
population in/newsite/erelease.aspx?relid=49731
Female literacy Census 2011
rates
Electrification Ministry of Power; available at http://rggvy.gov.in/rggvy/
rggvyportal/electrification_status.jsp
Low carbon Grid: Solar RPO Solar RPO requirement and compliance for 2012–13; 3.3
development performance available at http://www.mnre.gov.in/information/solar-rpo/
capacity (LCD)
index Off-grid: Biogas National biogas programme; basic data from
http://www.mnre.gov.in/related-links/decentralized-
systems/schems-2
Forest cover Forest Survey of India (2011)
Carbon footprint Difference between Ramachandra & Shwetmala (2012)
index CO2 emissions and
storage in Gg
Further to identifying and collecting basic data, computation and
standardization of indicator values is done so that it falls in the range
of 0–1. This procedure makes the respective values of the chosen
indicators (as mentioned in Table 3.2) unit less, so that indicators
are comparable for construction of an index. In the index, the best
performer hence gets a value of 1, while the worst performer gets a
value of 0. Moreover, all values become uni-directional.
Chapter 3 Informing Sub-National Actions 323