Page 360 - Low Carbon Development in China and India
P. 360
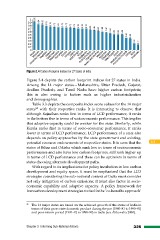
Figure 3.4 Carbon Footprint Indices for 27 States of India 3.3
Figure 3.4 depicts the carbon footprint indices for 27 states in India.
Among the 14 major states—Maharashtra, Uttar Pradesh, Gujarat,
Andhra Pradesh, and Tamil Nadu have higher carbon footprints;
this is also owing to factors such as higher industrialization
and demographics.
Table 3.3 depicts the composite index score values for the 14 major
states22 with their respective ranks. It is interesting to observe that
although Rajasthan ranks first in terms of LCD performance, it ranks
in the bottom five in terms of socioeconomic performance. This implies
that adaptive capacity could be weaker for the state. Similarly, while
Kerala ranks first in terms of socio-economic performance, it ranks
lower in terms of LCD performance. LCD performance of a state also
depends on policy approaches by the state government and existing,
potential resource endowments of respective states. It is seen that the
states of Bihar and Odisha which rank low in terms of socioeconomic
performance and also have low carbon footprints, still rank higher up
in terms of LCD performance and there can be optimism in terms of
states choosing alternate development paths.
With regard to its implications for policy incubation in low carbon
development and equity space, it must be emphasized that the LCD
strategies considering the sub-national context of India must consider
not only mitigation of carbon emissions; it must also factor in socio-
economic capability and adaptive capacity. A policy framework for
low carbon development strategies rooted in the ‘co-benefits approach’
22 The 14 major states are based on the achieved growth of the states of India in
terms of their gross state domestic product during the pre (1980–81 to 1990–91)
and post-reform period (1991–92 to 1998–99) in India (see Ahluwalia 2000).
Chapter 3 Informing Sub-National Actions 325