Page 359 - Low Carbon Development in China and India
P. 359
The standardization procedure using x as a variable is as follows:
x – index = [x – min(x)]/[max(x) – min(x)]
Here min(x) and max(x) were the lowest and highest values for the
variable x. The scores received by each state with respect to each
indicator are then averaged. These are then depicted graphically in the
following sections.
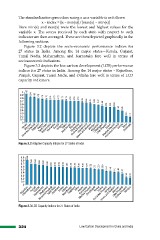
Figure 3.2 depicts the socio-economic performance indices for
27 states in India. Among the 14 major states—Kerala, Gujarat,
Tamil Nadu, Maharashtra, and Karnataka fare well in terms of
socioeconomic indicators.
Figure 3.3 depicts the low carbon development (LCD) performance
indices for 27 states in India. Among the 14 major states – Rajasthan,
Punjab, Gujarat, Tamil Nadu, and Odisha fare well in terms of LCD
capacity indicators.
Figure 3.2 Adaptive Capacity Indices for 27 States of India
Figure 3.3 LCD Capacity Indices for 27 States of India
324 Low Carbon Development in China and India
x – index = [x – min(x)]/[max(x) – min(x)]
Here min(x) and max(x) were the lowest and highest values for the
variable x. The scores received by each state with respect to each
indicator are then averaged. These are then depicted graphically in the
following sections.
Figure 3.2 depicts the socio-economic performance indices for
27 states in India. Among the 14 major states—Kerala, Gujarat,
Tamil Nadu, Maharashtra, and Karnataka fare well in terms of
socioeconomic indicators.
Figure 3.3 depicts the low carbon development (LCD) performance
indices for 27 states in India. Among the 14 major states – Rajasthan,
Punjab, Gujarat, Tamil Nadu, and Odisha fare well in terms of LCD
capacity indicators.
Figure 3.2 Adaptive Capacity Indices for 27 States of India
Figure 3.3 LCD Capacity Indices for 27 States of India
324 Low Carbon Development in China and India