Page 357 - Low Carbon Development in China and India
P. 357
• Articulation of capability
• Boundaries for considering greenhouse gas emissions
• Timing for considering historical responsibility
Ambitious targets for human development in the post-2015
development agenda need to embed a strong focus on moral concepts
such as equity (Melamed & Samman 2013). According to Sen
(1987: 36), capabilities refer to notions of freedom and opportunities
in life. In line with this, the metrics developed for socio-economic
capability include elements around opportunities that result from
performances linked to public infrastructure, income, education, and
empowerment of local institutions.
In this section, we will first see the key indicators relevant to
emissions and low carbon development for the world, OECD, India,
and China. We, then, attempt to articulate ‘capability’ in the context
of socio-economic and low carbon development performance for the
states in India.
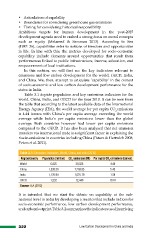
Table 3.1 depicts population and key emissions indicators for the
world, China, India, and OECD for the year 2010. It can be seen from
the table that according to the latest available data of the International
Energy Agency (IEA), the world average for per capita CO2 emissions
is 4.44 tonnes with China’s per capita average exceeding the world
average while India’s per capita emissions lower than the global
average. Both countries however had lower per capita emissions
compared to the OECD. It has also been analysed that net emission
transfers via international trade is a significant factor in explaining the
rise in emissions in countries including China (Peters & Hertwich 2008;
Peters et al. 2011).
Table 3.1: Emissions Indicators: World, China, and India (2010)
Region/country Population (million) CO2 emissions (Mt) Per capita CO2 emissions (tonnes)
World 6,825 30,326 4.44
China 1,338.30 7,269.85 5.43
India 1,170.94 1,625.79 1.39
OECD 1,232 12,440 10.10
Source: IEA (2012)
It is intended that we start the debate on capability at the sub-
national level in India by developing a metrics that include indices for
socio-economic performance, low carbon development performance,
andcarbonfootprint.Table3.2summarizestheindicatorsusedinarriving
322 Low Carbon Development in China and India
• Boundaries for considering greenhouse gas emissions
• Timing for considering historical responsibility
Ambitious targets for human development in the post-2015
development agenda need to embed a strong focus on moral concepts
such as equity (Melamed & Samman 2013). According to Sen
(1987: 36), capabilities refer to notions of freedom and opportunities
in life. In line with this, the metrics developed for socio-economic
capability include elements around opportunities that result from
performances linked to public infrastructure, income, education, and
empowerment of local institutions.
In this section, we will first see the key indicators relevant to
emissions and low carbon development for the world, OECD, India,
and China. We, then, attempt to articulate ‘capability’ in the context
of socio-economic and low carbon development performance for the
states in India.
Table 3.1 depicts population and key emissions indicators for the
world, China, India, and OECD for the year 2010. It can be seen from
the table that according to the latest available data of the International
Energy Agency (IEA), the world average for per capita CO2 emissions
is 4.44 tonnes with China’s per capita average exceeding the world
average while India’s per capita emissions lower than the global
average. Both countries however had lower per capita emissions
compared to the OECD. It has also been analysed that net emission
transfers via international trade is a significant factor in explaining the
rise in emissions in countries including China (Peters & Hertwich 2008;
Peters et al. 2011).
Table 3.1: Emissions Indicators: World, China, and India (2010)
Region/country Population (million) CO2 emissions (Mt) Per capita CO2 emissions (tonnes)
World 6,825 30,326 4.44
China 1,338.30 7,269.85 5.43
India 1,170.94 1,625.79 1.39
OECD 1,232 12,440 10.10
Source: IEA (2012)
It is intended that we start the debate on capability at the sub-
national level in India by developing a metrics that include indices for
socio-economic performance, low carbon development performance,
andcarbonfootprint.Table3.2summarizestheindicatorsusedinarriving
322 Low Carbon Development in China and India