Page 51 - Low Carbon Development in China and India
P. 51
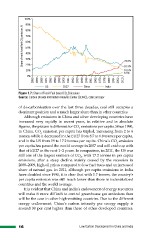
Figure 1.7: Share of Fossil Fuel based CO2 Emissions
Source: Carbon Dioxide Information Analysis Center (CDIAC), cdiac.ornl.gov
of de-carbonization over the last three decades, coal still occupies a
dominant position and a much larger share than in other countries.
Although emissions in China and other developing countries have
increased very rapidly in recent years, in relative and in absolute
figures, the picture is different for CO2 emissions per capita. Since 1990,
in China, CO2 emission per capita has tripled, increasing from 2 to 6
tonnes, while it decreased in the EU27 from 8.7 to 6.8 tonnes per capita,
and in the US from 19 to 17.2 tonnes per capita. China’s CO2 emission
per capita has passed the world average in 2007 and will catch up with
that of EU27 in the next 1–2 years. In comparison, in 2011, the US was
still one of the largest emitters of CO2, with 17.2 tonnes in per capita
emissions, after a steep decline mainly caused by the recession in
2008–2009, high oil prices compared to low fuel taxes and an increased
share of natural gas. In 2011, although per capita emissions in India
have doubled since 1990, it is clear that with 1.7 tonnes, the country’s
per capita emission was still much lower than those in industrialized
countries and the world average.
It is evident that China and India’s endowment of energy resources
will make it more difficult to control greenhouse gas emissions than
will be the case in other high-emitting countries. Due to the different
energy endowment, China’s carbon intensity per energy supply is
around 30 per cent higher than those of other developed countries.
16 Low Carbon Development in China and India