Page 52 - Low Carbon Development in China and India
P. 52
1.0
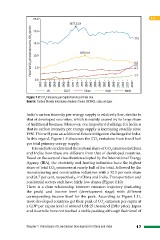
Figure 1.8: CO2 Emissions per Capita from Fossil Fuel Use
Source: Carbon Dioxide Information Analysis Center (CDIAC), cdiac.ornl.gov
India’s carbon intensity per energy supply is relatively low, similar to
that of developed countries, which is mainly caused by its large share
of traditional biomass. Moreover, one important challenge for India is
that its carbon intensity per energy supply is increasing steadily since
1990. This will pose an additional future mitigation challenge for India.
In this regard, Figure 1.9 discusses the CO2 emissions from fossil fuel
per total primary energy supply.
It is useful to understand the sectoral share of CO2 emission in China
and India; how these are different from that of developed countries.
Based on the sectoral classification adopted by the International Energy
Agency (IEA), the electricity and heating industries have the highest
share of total CO2 emissions at nearly half of the total, followed by the
manufacturing and construction industries with a 32.3 per cent share
and 24.7 per cent, respectively, in China and India. Transportation and
residential sectors each have fairly low shares (Figure 1.10).
There is a clear relationship between emission trajectory (including
the peak) and income level (development stage) with different
corresponding income level for the peak. According to Figure 1.11,
most developed countries get their peak of CO2 emission per capita at
a GDP per capita level of around US$ 25 thousand (2010 price). Japan
and Australia have not reached a stable peaking although their level of
Chapter 1 Dimensions of Low Carbon Development in China and India 17