Page 53 - Low Carbon Development in China and India
P. 53
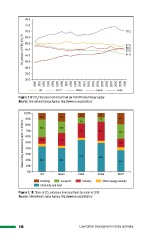
Figure 1.9: CO2 Emissions from Fossil Fuel per Total Primary Energy Supply
Source: International Energy Agency, http://www.iea.org/statistics/
Figure 1.10: Share of CO2 emissions from fossil fuels by sector in 2010
Source: International Energy Agency, http://www.iea.org/statistics/
18 Low Carbon Development in China and India
Source: International Energy Agency, http://www.iea.org/statistics/
Figure 1.10: Share of CO2 emissions from fossil fuels by sector in 2010
Source: International Energy Agency, http://www.iea.org/statistics/
18 Low Carbon Development in China and India