Page 265 - Low Carbon Development in China and India
P. 265
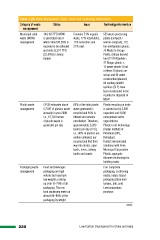
Table 1.20: Waste Management: Status, Issues and Technology Interventions
Category of waste Status Issue Technology intervention
management
Municipal solid 144,165 TPD MSW Contains 51% organic 535 waste processing
waste (MSW) is generated out of waste, 17% recyclables, plants (compost /
management which about 80.28% is 11% hazardous and vermin-compost), 172
reported to be collected 21% inert bio-methanation plants,
and only 32,871 TPD 76 Waste to Energy
(22.80%) is being Plants, (refuse derived
treated fuel (22 RDF/pellet+-,
41 Biogas plants-+,
13 power plants-) (out
of these 30 plants are
set up and 46 under
construction/planned,
94 sanitary landfill
facilities (SLF) have
been constructed in the
country for disposal of
MSW
Plastic waste CPCB estimated about 60% of the total plastic Plastic recycling in India
management 5.7 MT of plastics waste waste generated is is carried out by 3,500
annually in year 2008 recycled and 40% is organized and 4,000
i.e., 15,722 tonnes littered and remains unorganized sector
of plastic waste is uncollected. Therefore, organizations
generated per day. approximately, 6,289 Plastic to oil technology
tonnes per day (TPD), (Indian Institute of
i.e., 40% of plastics are Petroleum (IIP),
neither collected, nor Dehradun)
recycled and find their Rudra Environmental
way into drains, open Solutions with Pune
lands, rivers, railway Municipal Corporation
tracks and coasts Plastic-aggregate
Bitumen Technology for
building roads
Packaging waste Food and beverages Coir composite
management packaging are high packaging, cushioning
volume but may have media, nature-based
low weights, making packaging (fibre from
up only 15–20% of all banana, jute, coir)
packaging. The non- Low temperature
food packaging make up pyrolysis
almost 80–90% of the
packaging by weight
contd...
230 Low Carbon Development in China and India