Page 62 - Low Carbon Development in China and India
P. 62
direct increases in energy efficiency; other factors can play a role, such
as structural changes that base a higher share of the economy on less
energy-intensive industry, and fluctuating materials prices.
Table 1.2 International Comparison of 2000 and 2005 Energy Intensity (TCE/Million USD) 2.1
Country/Group 2000 2005
China 743 790
USA 236 212
Japan 113 106
EU 204 197
India 664 579
OECD 208 195
Non-OECD 603 598
World 284 284
Note According to the 2000 value of USD
Source The Institute of Energy Economics, Japan, 2008
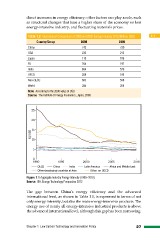
Figure 1.1 Aggregate Industry Energy Intensity (1990–2010)
Source: IEA, Energy Technology Perspective 2012
The gap between China’s energy efficiency and the advanced
international level, as shown in Table 1.1, is expressed in terms of not
only energy intensity, but also the main energy-intensive products. The
energy use of nearly all energy-intensive industrial products is above
the advanced international level, although this gap has been narrowing.
Chapter 1 Low Carbon Technology and Innovation Policy 27
as structural changes that base a higher share of the economy on less
energy-intensive industry, and fluctuating materials prices.
Table 1.2 International Comparison of 2000 and 2005 Energy Intensity (TCE/Million USD) 2.1
Country/Group 2000 2005
China 743 790
USA 236 212
Japan 113 106
EU 204 197
India 664 579
OECD 208 195
Non-OECD 603 598
World 284 284
Note According to the 2000 value of USD
Source The Institute of Energy Economics, Japan, 2008
Figure 1.1 Aggregate Industry Energy Intensity (1990–2010)
Source: IEA, Energy Technology Perspective 2012
The gap between China’s energy efficiency and the advanced
international level, as shown in Table 1.1, is expressed in terms of not
only energy intensity, but also the main energy-intensive products. The
energy use of nearly all energy-intensive industrial products is above
the advanced international level, although this gap has been narrowing.
Chapter 1 Low Carbon Technology and Innovation Policy 27