Page 60 - Low Carbon Development in China and India
P. 60
CHAPTER LOW CARBON
1 TECHNOLOGY AND
INNOVATION POLICY
1.1 Introduction
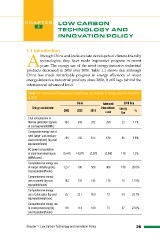
Although China and India are late developers of climate-friendly
technologies, they have made impressive progress in recent
years. The energy use of the most energy-intensive industrial
products decreased in 2010 over 2000. Table 1.1 shows that although
China has made remarkable progress in energy efficiency of major
energy-intensive industrial products since 2000, it still lags behind the
international advanced level.
Table 1.1 International Comparison Using Energy Use Indicator in Energy-intensive Industries
in 2010
China Advanced 2010 Gap
Energy use indicator 2000 2005 2010 International Energy %
Level Use
Coal consumption of 290 22 7.1%
thermal generators (grams 363 343 312
of coal equivalent/kWh)
Comparable energy use of
steel (large- and medium- 784 732 675 610 65 9.6%
sized enterprises) (kg coal
equivalent/tonne)
AC power consumption 15,418 14,575 13,979 13,800 179 1.3%
of aluminium electrolysis
(kWh/tonne)
Comprehensive energy use
of copper metallurgy (kg 1,277 780 500 360 140 28.0%
coal equivalent/tonne)
Comprehensive energy 183 178 143 118 25 17.5%
use of cement (kg coal
equivalent/tonne)
Comprehensive energy 25 22.7 16.9 13 3.9 23.1%
use of plate glass (kg coal
equivalent/weigh box)
Comprehensive energy use
of crude processing (kg 118 114 100 73 27 27.0%
coal equivalent/tonne)
Chapter 1 Low Carbon Technology and Innovation Policy 25
1 TECHNOLOGY AND
INNOVATION POLICY
1.1 Introduction
Although China and India are late developers of climate-friendly
technologies, they have made impressive progress in recent
years. The energy use of the most energy-intensive industrial
products decreased in 2010 over 2000. Table 1.1 shows that although
China has made remarkable progress in energy efficiency of major
energy-intensive industrial products since 2000, it still lags behind the
international advanced level.
Table 1.1 International Comparison Using Energy Use Indicator in Energy-intensive Industries
in 2010
China Advanced 2010 Gap
Energy use indicator 2000 2005 2010 International Energy %
Level Use
Coal consumption of 290 22 7.1%
thermal generators (grams 363 343 312
of coal equivalent/kWh)
Comparable energy use of
steel (large- and medium- 784 732 675 610 65 9.6%
sized enterprises) (kg coal
equivalent/tonne)
AC power consumption 15,418 14,575 13,979 13,800 179 1.3%
of aluminium electrolysis
(kWh/tonne)
Comprehensive energy use
of copper metallurgy (kg 1,277 780 500 360 140 28.0%
coal equivalent/tonne)
Comprehensive energy 183 178 143 118 25 17.5%
use of cement (kg coal
equivalent/tonne)
Comprehensive energy 25 22.7 16.9 13 3.9 23.1%
use of plate glass (kg coal
equivalent/weigh box)
Comprehensive energy use
of crude processing (kg 118 114 100 73 27 27.0%
coal equivalent/tonne)
Chapter 1 Low Carbon Technology and Innovation Policy 25