Page 304 - Low Carbon Development in China and India
P. 304
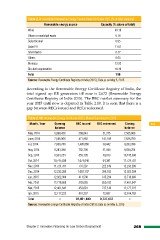
Table 2.9: Accredited Renewable Energy Source Break Up Under REC (% of total capacity)
Renewable energy source Capacity (% share of total)
Wind 49.18
Urban or municipal waste 0.16
Solar thermal 0.05
Solar PV 11.81
Small hydro 6.37
Others 0.03
Biomass 13.92
Bio-fuel cogeneration 18.46
Total 100
Source: Renewable Energy Certificate Registry of India (2015); Data as on May 5, 2015
According to the Renewable Energy Certificate Registry of India, the
total signed up RE generators till now is 2,672 (Renewable Energy
Certificate Registry of India 2015). The REC market summary for the
year 2015 until now is depicted in Table 2.10. It is seen that there is a
gap between RECs issued and RECs redeemed.
Table 2.10: Renewable Energy Certificate (REC) Market Summary for 2015
Month, Year Opening REC issued REC redeemed Closing 3.2
balance balance
May, 2014 6,968,438 568,843 31,375 7,505,906
June, 2014 7,505,906 471,982 141,108 7,836,780
Jul, 2014 7,836,780 1,485,060 38,442 9,283,398
Aug, 2014 9,283,398 702,700 51,844 9,934,254
Sep, 2014 9,934,254 859,795 49,013 10,745,036
Oct, 2014 10,745,036 1,074,046 94,381 11,724,701
Nov, 2014 11,724,701 731,207 222,619 12,233,289
Dec, 2014 12,233,289 1,087,197 398,182 12,922,304
Jan, 2015 12,922,304 411,590 615,234 12,718,660
Feb, 2015 12,718,660 593,085 850,103 12,461,642
Mar, 2015 12,461,642 453,091 737,510 12,177,223
Apr, 2015 12,177,223 810,257 72,697 12,914,783
Total – 22,651,840 9,737,057 –
Source: Renewable Energy Certificate Registry of India (2015); Data as on May 5, 2015
Chapter 2 Innovative Financing for Low Carbon Development 269