Page 302 - Low Carbon Development in China and India
P. 302
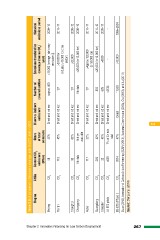
Chapter 2 Innovative Financing for Low Carbon Development Table 2.8: A comparison of emissions coverage under the ETS pilots in 2010
Region GHGs Covered CO2 Share Direct or indirect Number of Emissions threshold for Historical
emissions of total coverage (tonnes CO2/ emissions period
emissions emissions covered entities
(Mton) year) 2009–12
Beijing CO2 58 50% Direct and indirect approx. 490 >10,000 (average [stationary 2010–11
emissions]) 2009–12
2008–10
Tianjin CO2 112 45% Direct and indirect 197 >20,000 for
industry;>10,000 for other 2010–11
sectors 2010–12
2009–11
Shanghai CO2 90 60% Direct and indirect 191 >20,000
Chongqing CO2 No data Direct and indirect No data >20,000 (or 10,000 tce) -
Not yet
available 1996–2004
Hubei CO2 117 33% Direct and indirect 107 >Approx.120,000
(or 60,000 tce)
Guangdong CO2 209 42% Direct and indirect 830 >20,000 (or 10,000 tce)
Shenzhen
All ETS pilots CO2 32 40% Direct and indirect 635 >5000
CO2 >620 7% of China’s Direct and indirect >2535 -
total
EU-ETS (Phase I) CO2 2014 47% Direct 11,500 >10,000
Duan (2013), International Carbon Action Partnership (ICAP) (2013), European Commission (2013), Qiu (2013), and Xu (2013)
Source: Zhang et al. (2014)
267
3.2