Page 217 - Low Carbon Development in China and India
P. 217
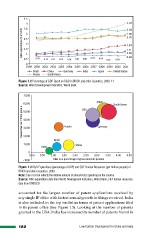
Figure 1.2 Percentage of GDP Spent on R&D in BRICK and other Countries, 2000–11
Source: World Development Indicators, World Bank
Figure 1.3 R&D Expenditure (percentage of GDP) and S&T Human Resources (per million people) of
BRICK and other countries, 2009
Note: Size of circle reflects the relative amount of annual R&D spending by the country
Source: R&D expenditure data from World Development Indicators, World Bank; S&T human resources
data from UNESCO
accounted for the largest number of patent applications received by
any single IP office with fastest annual growth in filings received. India
is also included in the top ten list in terms of patent applications filed
in its patent office (See Figure 1.5). Looking at the number of patents
granted in the USA, India has increased its number of patents from 8 in
182 Low Carbon Development in China and India