Page 313 - Low Carbon Development in China and India
P. 313
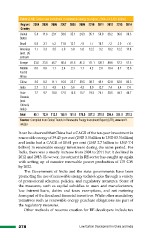
Table 2.13: Global new investment in renewable energy by region, 2004–14 (USD billion)
Region/ 2004 2005 2006 2007 2008 2009 2010 2011 2012 2013 2014
Country
United 5.4 11.6 29.1 33.0 35.1 24.3 35.1 50.0 38.2 36.0 38.3
States
Brazil 0.8 3.1 5.2 11.8 12.1 7.9 7.7 10.1 7.2 3.9 7.6
Americas 1.7 3.3 3.9 5.0 5.8 5.8 12.2 9.2 10.2 12.2 14.8
(excl. US
& Brazil
Europe 23.6 33.6 46.7 66.4 81.6 81.2 111.1 120.7 89.6 57.3 57.5
Middle 0.6 0.8 1.1 2.4 2.3 1.7 4.2 2.9 10.4 8.7 12.6
East &
Africa
China 3.0 8.2 11.1 16.6 25.7 39.5 38.7 49.1 62.8 62.6 83.3
India 2.7 3.1 4.9 6.3 5.6 4.3 9.0 12.7 7.4 6.4 7.4
Asia- 7.2 9.2 10.0 12.5 13.6 13.7 19.3 24.1 30.5 44.7 48.7
Oceania
(excl.
China &
India)
Total 45.1 72.9 112.1 153.9 181.8 178.5 237.2 278.8 256.4 231.8 270.2
Source: Compiled from Global Trends in Renewable Energy Investment Report (GTR), www.ren21.
net/gsr
It can be observed that China had a CAGR of the ten-year investment in
renewable energy of 39.43 per cent (USD 3.0 billion to USD 83.3 billion)
and India had a CAGR of 10.61 per cent (USD 2.7 billion to USD 7.4
billion) in renewable energy investment during the same period. For
India, there was a steady increase from 2004 to 2011 but it declined in
2012 and 2013. However, investment in RE sector has caught up again
with setting up of massive renewable power production of 175 GW
by 2022.
The Government of India and the state governments have been
promoting the use of renewable energy technologies through a variety
of promotional schemes, policies, and regulatory measures. Some of
the measures, such as capital subsidies to users and manufacturers,
low interest loans, duties and taxes exemptions, and net metering
form part of the fiscal and financial incentives. While other mandatory
initiatives such as renewable energy purchase obligations are part of
the regulatory measures.
Other methods of revenue creation for RE developers include tax
278 Low Carbon Development in China and India