Strong policies needed to clean Delhi NCR air by 2025: ARAI & TERI report
Joint scientific study report by commissioned by Ministry of Heavy Industries & Public Enterprises assesses the present source contributions towards PM2.5 & PM10 concentrations
TERI and ARAI conducted an exhaustive scientific study for Delhi-NCR to derive sectoral contributions to air pollution (PM levels) and project the future to develop air quality management plans. The study was based on 2 approaches (See report) :
- Receptor Modelling- collection of particulate samples at 20 predefined locations, their chemical analysis and source apportionment to known sources (transport, industry, biomass burning, construction, etc.). Air Samples were collected for 10 days in 2 seasons during the year. Experimental data establishes strong foundation for the prediction, simulation and analysis.
- Dispersion modelling- using advanced chemical transport modelling approach and emission inventory based on latest emission factors. Utilised for development and testing of appropriate strategies for control of air pollution in Delhi-NCR
The results of both the approaches were assessed and future scenarios were developed in order to propose air pollution mitigation strategies for Delhi-NCR.
TERI and ARAI presents the study report of the source apportionment of PM2.5 and PM10 concentrations in Delhi NCR based on two approaches - Receptor and Dispersion modelling. TERI carried out the dispersion modelling and ARAI carried out the receptor modelling study. Both the model results are found to be consistent, and also broadly aligned with the earlier study conducted by IITK in 2015. This new evaluation also takes into consideration additional key elements:
- Source apportionment results for several NCR towns other than Delhi
- Wider NCR region considered for emission inventorisation and dispersion modelling to account for contributions from outside of Delhi
- Boundary conditions from India scale modelling used to account for contributions from sources beyond NCR
- Use of most advanced chemical transport modelling approach to also incorporate secondary particulate formation and its apportionment
- Use of newly developed emission factors and source profiles for BS-IV vehicles
The study also projects future sectoral emissions and air quality and tests several interventions which can reduce pollution in the region. This will enable development and testing of appropriate strategies for control of air pollution in Delhi-NCR.
The modelling was based on comprehensive air quality monitoring which was carried out at twenty representative locations for 10 days at each location in for two seasons (in 2016-17) in Delhi and NCR. Both PM10 and PM2.5 average concentrations were found to be more than the prescribed National Ambient Air Quality Standards by CPCB [Central Pollution Control Board]. The daily permissible limits of PM2.5 and PM10 are 60 g/m3 and 100 g/m3 respectively, as per the National Ambient Air Quality Standards. The average concentrations that were monitored were:
|
Average Concentration [across all sites in Delhi-NCR] |
PM10 |
PM2.5 |
|
Winter |
314 ± 77 μg/m3 |
168 ± 45 μg/m3 |
|
Summer |
188 ± 37 μg/m3 |
90 ± 17 μg/m3 |
Contributing sources were identified using both receptor and dispersion models for the two seasons. The results for PM2.5 are as follows:
|
Delhi's PM2.5 Contributions [in %] in both seasons |
Dispersion Model |
Receptor Model |
|
Transport Sector |
17-28% |
20-30% |
|
Industries |
22-30% |
20% |
|
Biomass Burning |
14-15% |
16-23% |
|
Dust [Soil, Road & Construction] |
17-38% |
16-35% |
|
Other sources |
8-11% |
9-11% |
The results of the two modelling approaches are found to be similar for most of the sectors. The contribution of transport sector is found to be higher in this study than the contributions reported in IITK (2015) report, as this study includes secondary particulates along with the primary contributions. Industries operating in NCR contribute significantly to Delhi's pollution along with the contributions of biomass burnt in rural kitchen and agricultural fields. In this study, the contribution of agricultural burning is not fully accounted for - as the monitoring and modelling periods did not include the month of October, when the burning activities are generally at their maximum. Moreover, the sectorial contributions are averaged for the whole modelling/monitoring period, and hence, do not highlight the short term (daily or weekly) contribution of agricultural burning, which takes place on specific number of days and cause episodically high pollutant concentrations. Contribution of dust is more prominent in PM10. The results for PM10 are as follows:
|
Delhi’s PM10 Contributions [in %] in both seasons |
Dispersion Model |
Receptor Model |
|
Transport Sector |
15-24% |
17-25% |
|
Industries |
22-27% |
19-20% |
|
Biomass Burning |
14-15% |
13-15% |
|
Dust |
25-41% |
31-43% |
|
Others |
7-10% |
7-10% |
Key findings of the study for Delhi city are presented below:
(i) Within the 30% contribution of the industrial sector in PM2.5 concentrations (during winter) in Delhi; the breakup is as follows:
- 8% is contributed by bricks sector:
- 6% by power stations
- 2% by stone crushers
- 14% by other industries (using coal, biomass, pet-coke, and furnace oil)
[This is accounting for pet-coke and furnace oil use which was prevalent in 2016]
(ii) Within the 28% transport sector contribution in Delhi [winter PM2.5 concentrations accounting for both primary and secondary contributions]
- Trucks account for 8% (out of 28%)
- Two-wheelers 7% (out of 28%)
- Three-wheelers 5% (out of 28%)
- Cars 3.4% (out of 28%)
- Within this, older vehicles (Pre BS-IV) have higher contributions than BS-IV vehicles in the PM concentrations.
(iii) Within the biomass category, biomass burnt in rural kitchen and agricultural fields is the dominant factor contributing to PM2.5 and PM10 concentrations
(iv) In the Others category (within the overall contribution of 11% during winter PM2.5 concentrations)
- DG sets (owing to high PM and NOx emissions) contribute significantly (5%)
- Refuse burning (3%)
- Other sources (e.g. crematoria, restaurants, incinerators, etc) contributed to less than 1% each
(v) With Dust contributions of 17% (winter PM2.5 concentrations)
- Road dust (4%)
- Construction (1%)
- Others/soil (13%)
(vi) In PM10, the share of different sub-sectors almost remains same as PM2.5. However, the dust share is considerably increased with road dust and construction contributing to 8% and 6%, respectively, in Delhi's PM10 concentrations. Their share increases to 10% and 7%, respectively in NCR during winters.
The report also presents the sectoral shares in PM10 and PM2.5 concentrations of various other towns of NCR namely Bahadurgarh, Panipat, Ghaziabad, Noida, Gurgaon, and Faridabad. The report also provides geographical contributions which show that the average contribution of Delhi's own emissions in Delhi PM2.5 concentrations was found to be at 36% in winter and 26% in summer with variations in different places of the city.
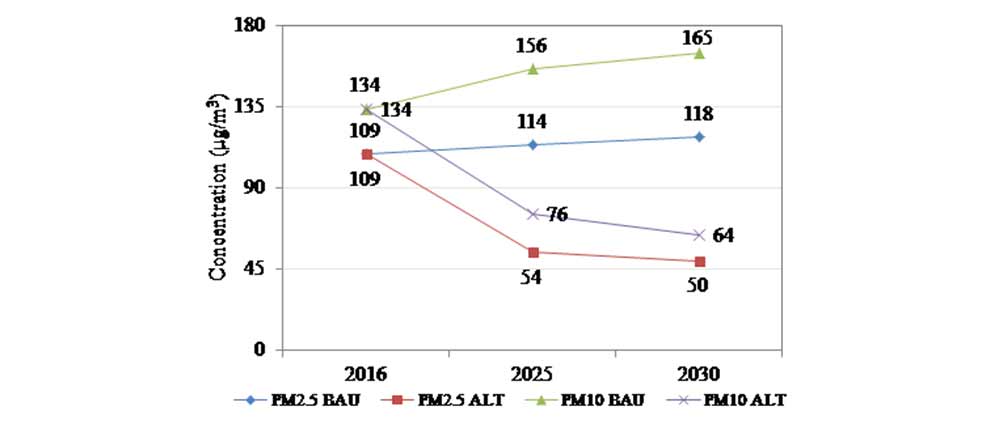
With a view to understand the contributions of future sectoral growth in air pollution in the region & in order to formulate feasible strategies, future scenarios were also developed. In this regard, probable future PM concentration growth scenarios have been assessed for the year 2025 (medium-term) and 2030 (long-term).
BAU [BUSINESS AS USUAL] Scenario
The BAU scenario assumes that all current policies are in place in 2025 and 2030 with probable enforcement stringencies.
|
Average Concentration [Winter-Summer Averages] |
PM10 |
PM2.5 |
|
Year 2016 |
134 μg/m3 |
109 μg/m3 |
|
Year 2030 |
165 μg/m3 |
118 μg/m3 |
BAU scenario reveals that the PM concentrations would be higher, if emission control strategies (such as BS-VI norms, LPG penetration, gaseous pollutant control standards in industries, zig-zag technology for brick kilns, etc.) envisaged in BAU are not implemented. These emission norms are expected to contribute significantly towards reducing (30%) concentration of PM10 and PM2.5 by the year 2030.
Despite this, the BAU scenario shows slightly more pollutant concentrations in future than at present, and hence, additional strategies are necessary to prevent further increase of air pollutants. In the BAU 2030 scenario, the share of Transport, Industries, Biomass , Dust and Others in PM2.5 concentrations (winters) is estimated to be 16%, 44%, 13%, 19%, and 8%, respectively. The study assesses various strategies across different sectors which can reduce pollutant concentrations in Delhi and NCR.
Alternative Scenario
Based on the strategies for control, an alternative scenario was developed for 2025 and 2030, which shows reduction in average concentration (of both seasons) by 58% in PM2.5 and 61% in PM10 (Figure below) with respect to BAU.
The alternative scenario envisages meeting the prescribed daily standards in the winter season and hence, it may be safely assumed that annual average standards may be met considering lower concentrations during other seasons. The alternative scenario suggests desirable interventions, which are expected to have higher impact on PM concentrations through reduction of pollutant emissions in 2025 and 2030:
- Complete phase out of biomass use in NCR by enhanced LPG penetration in rural households
- Use of agricultural residues in power plants and other industries to replace high ash coal and open burning in fields
- Introduction of gaseous fuels and enforcement of new and stringent SO2/NOx/PM2.5 standards for industries using solid fuels
- Strict implementation of BS-VI norms by 2020
- Improvement and strengthening of inspection and maintenance system for vehicles
- Fleet modernisation and retro-fitment programs with control devices
- Enhanced penetration of electric and hybrid vehicles
- Reducing real world emissions by congestion management
- Stricter enforcement of standards in large industries through continuous monitoring
- Full enforcement of Zig-Zag brick technology in brick kilns
- Vacuum cleaning and wall to wall paving of roads
- Control of dust from construction activities using enclosures, fogging machines and barriers
- Elimination of DG set usage by provision of 24x7 electricity and control by innovative tail-pipe control technologies
For further information, contact:
TERI:
Pallavi Singh: pallavi.singh@teri.res.in
Edelman:
Sneha Dev: Sneha.dev@edelman.com![]()